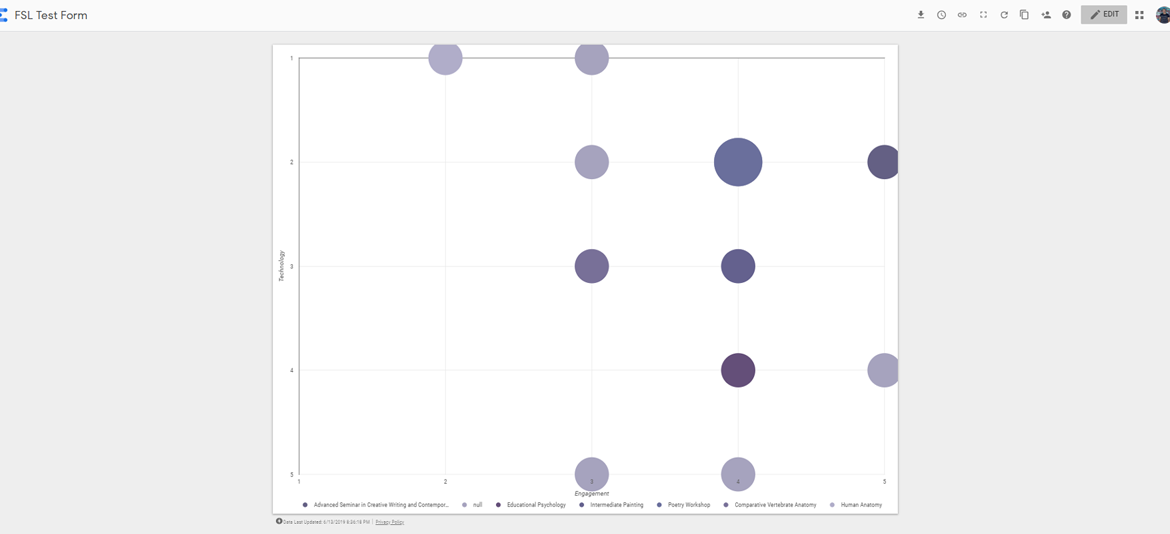
This week was spring break and was spent playing around in Google Data Studio. The goal is to make a bubble chart that live updates once a form is filled out for live data of where professors have placed themselves on the grid.
I had never used data studio before and after some time playing around, this is what the report looks like live right now with some sample/older data.
https://datastudio.google.com/open/1vrBY0yE1Cc3WAQqWwQnungOFAfXIH8Ay
Some of the things I figured out was how to import data from a response sheet that I created off of a form I created. I also used formulas to translate the axis names into numbers. One helpful tool in data studio is the ability to change the direction of the axes. This means that the y axis for the grid can have 1 start at the top and five at the bottom.
The projects I want to keep working on are finding out how to add padding to the outside so the bubbles are not cut off on the edges. When the bubbles are rolled over, the information for only one person (if there are multiple) only appears. I also want to find a better way to formulate the count and try to hide it in the final version.
I also worked on sound editing the videos and only adding music to the intro and outros of the videos. Next week I will work with Ruthie on confirming the rest of the videos and starting to work with the professors for the next round of videos.