The main focus of this week was the intersections. This meant focusing on the mix of both of the axies of the grid and where they meet.
At the beginning of the week, I helped to make an animation of the grid showing the intersection of engagement and technology for the professor videos. This video really helped me to visualize the combination and necessity of both axes instead of only focusing on one.
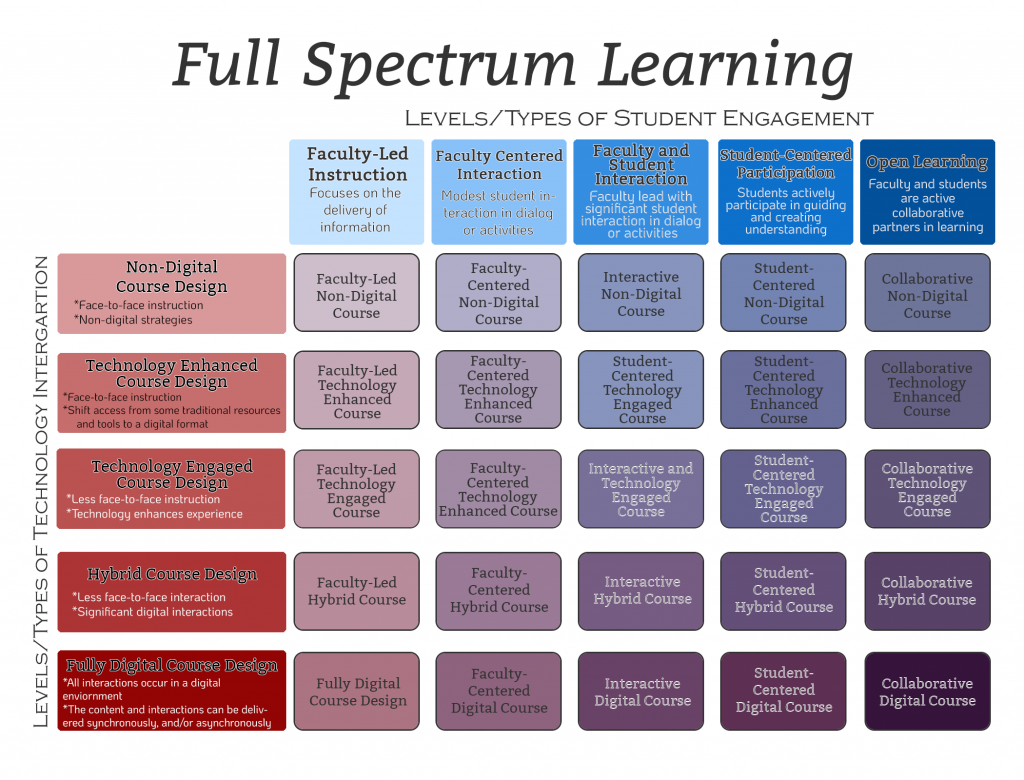
The rest of the week was spent naming all of the other intersections to make the grid easier to visualize and stress the importance of the intersections instead of just the axes.
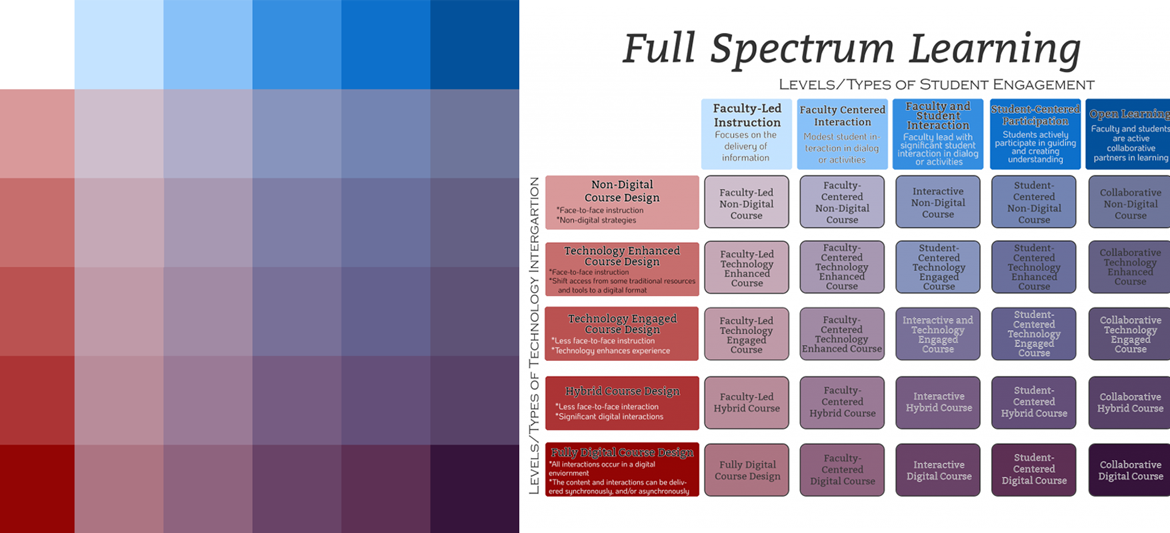
Another helpful visualization tool I created was the color grid. This shows all the intersections as a mix of the colors from each axis and makes it a bit easier to visualize. The engagement axis varies from light to dark blue and the technology axis varies from light to dark red. The intersections are then the mix of these colors and it helps visualize which intersections have more red or technology and the others that have more blue or engagement.

I then combined the ideas of color and the intersection names to remake a colorful version of the grid. This grid helps to show the engagement levels of each intersection through color.
A very interesting step forward, Cassie. The animation is very helpful in focusing the message and I am intrigued by the colored grid. That idea seem consistent with the FSP message.